Record Prices Paid For ‘Superman’ Comics Could Bode Well For Warner Bros Discovery Sale
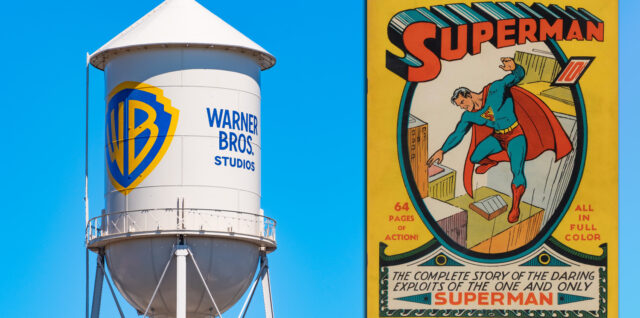
No matter who ends up owning Warner Bros Discovery, Superman will remain a jewel in the the 102-year-old studio’s crown. With big bucks bids for the currently David Zaslav-run company now in from Paramount, Comcast and Netflix, another auction of sorts down in Texas that put a winning price tag on Man from Krypton’s IP [.]. Continue reading Record Prices Paid For ‘Superman’ Comics Could Bode Well For Warner Bros Discovery Sale